Category Archives: Nutrients

Onion Crop Research Plan

After identifying areas within paddocks that had yields limited by different probably causes, we conceived the idea of Management Action Zones (MAZs).

Yield assessments show considerable variation, limits imposed by population, growth of individual plants, or both

Some areas showed that yield was limited by plant number: establishment was poor. Others had the expected population, but low biomass: the plants were small due to some other limiting factor.

If we can identify zones easily, and determine the causes, we should be able to target a management response accordingly. So for this season, we set out a revised research aim.

What we want to know:

  • Can we successfully determine a management action zone in a field?

Why do we need to know this?

  • Develop a tool to increase uniformity and yield outcomes
  • Develop a tool to evaluate management practices and crop productivity

If we want to successfully determine a management action zone in a field then there are two main steps to achieve in this year’s work:

  • Confirm the relationship between digital data and crop model parameters
    • Does the relationship stay constant over time and sites?
    • How early in growth can a difference be detected?
    • Can the relationship be used to show a growth map across a field?
  • Develop an approach to gather information and ways to input and display results, initially using a website approach.
    • Can we integrate a plant count and yield information to start developing a management action zone?
    • How should this be put together in a way growers can start to use to gather information about their crops?

At the MicroFarm, we established six research zones based on paddock history and excessive wetness at establishment.

We have three paddock histories: two years of onion production with autumn cover crops of Caliente mustard, two years of onion production with autumn cover crops of oats, and no previous onion crops planted after previous summer sweetcorn and autumn sown rye grass. In each of these areas, we deliberately created sub-zones  by applying about 45mm of spray irrigation as a “large rain event”.

Artificial heavy rain event applied after planting and before emergence

The impact of the artificial rainstorm is evident on images taken at the end of November.

The lasting effect of a heavy (artificial) rain event pre-emergence (right panel) shows low population and poor growth compared to areas without heavy rain (left panel)

Technology to Reduce N Leaching

N-Leach_WorkshopThe Precision Agriculture Association NZ is presenting workshops focused on technologies available to help reduce nitrogen leaching. There are two North Island workshops being offered at:

Massey University on Thursday 1st September 2016 [PDF here]

and

Ellwood Centre, Hastings on Friday 2nd September 2016 [PDF here]

Programme

The ‘Technology to Reduce N Leaching’ workshops are similar to the well received program conducted in Ashburton in March 2016 and will address where we are and what we can do about nitrate leaching limits in a North Island context utilising a range of technologies and farm systems options.

The particular areas for focus for the program are:

  • Variable rate technologies and systems
  • Precision irrigation
  • Precision spreading systems and services
  • Soil mapping
  • Soil moisture monitoring, sensors, metering
  • Nutrient budgeting and environmental monitoring

A Q & A time slot is devoted in the afternoon session for attendees to interact with members and presenters on the day to share learnings and understandings about the issues. This will also be possible over the lunch break on both days with one and half hours devoted for this.

PAANZ2

Offer to PAANZ Members

As part of the Hastings program only on 2nd September, PAANZ members are offered the opportunity to participate as trade/sector participants for technologies and products as may be appropriate to support the program.

PAANZ is not able to offer trade/sector stand space at the Palmerston North venue due to space restrictions unfortunately so only the Hastings venue will be able to accommodate this option for members.

If you would like to participate please advise Jim Grennell, E-mail: jim@paanz.co.nz

Mobile: 021 330 626, places are limited to ten organisations for the Hastings workshop to be involved as a trade/sector participant so it will be on a first come basis.

The cost of participation will be $100.00 plus GST per stand with attendance fee of $100.00 per person additional.

As these are indoors Workshops, with a technology focus and space at the Hastings venue is limited no large equipment or hardware can be accommodated.

Confirmation of members wishing to take up this opportunity is required by Monday 22nd August 2016 after which time the opportunity to participate will be made available to non-members.

Profit Mapping Variability in Onions

Profit Bands Across A Paddock

 Justin Pishief

Justin Pishief and Dan Bloomer
Centre for Land and Water


As part of the Onions NZ project “Benchmarking Variability in Onion Crops” a process was developed to generate yield and profit maps. This presentation explains the process using the example of a 7.3 ha paddock in Hawke’s Bay.

Data from a satellite image captured in late November were used to identify high, medium and low biomass zones.  Paddock yield samples were taken from these zones at harvest and used to generate a paddock yield map. The average yield of the paddock was estimated at 95 t/ha, with a predicted total field harvest of 669 tonnes. This compares to the grower recorded harvest of 614 tonnes.

The relative yield data were combined with grower supplied costs and returns to determine gross margins across the paddock. Data were mapped in ArcGIS and a Gross Margin map with five “profit bands” produced. The highest band had a mean Gross Margin of $11,884/ha compared to the lowest at $3,225/ha.

The breakeven gross margin yield is estimated to be 62.5 t/ha at current costs and prices. The estimated cost to business of low performing areas is $27,945, assuming the whole paddock could achieve the top band mean yield.

The poorest performing areas were identified by the grower as impacted by a failed council drain and areas of slowed drainage in the main paddock areas. An OptiSurface® assessment using historic HBRC LiDAR elevation data analysed of the impact of ponding on the site and also suggested ponding was a significant issue.

An OptiSurface® landform assessment was conducted using both single plain and optimised surface designs and the soil movement required to allow effective surface drainage was determined.

The assessment showed ponding could be avoided by land shaping with 224 m3/ha soil movement and few areas requiring more than 100 mm cut or fill. The cost is estimated at $2,000/ha or approximately $14,000 total.

On-Farm Fertiliser Applicator Calibration

Guidance for farmers – check performance of fertiliser spreading

DanBloomer200

Dan Bloomer
LandWISE

Fertiliser application calibration procedures suitable for farmers applying nutrients with their own equipment have been developed.  Guidelines and a web-based calculator (see www.fertspread.nz) support on-farm checks to ensure and demonstrate application equipment is performing to expectations.

Farmers and agronomists had noticed striping in crops, especially when spreading bout widths increased to match wide sprayer bouts. Visible striping is indicative of very significant non-uniform distribution and yield loss.

A calibration check includes assessment and correcting of both application rate (kg/ha) and uniformity (CV). Farmers indicate determining the rate is reasonably easy and commonly done. Very few report completing any form of uniformity assessment.

FertSpread calculates uniformity from data from a single pass and mathematically applies overlap using both to and fro and round and round driving patterns. Test spread-pattern checks performed to date show there is a need for wider testing by farmers. Unacceptable CVs and incorrect application rates are the norm.

Fertiliser applicator manufacturers provide guidelines to calibrate equipment and some newer machines automatically adjust to correct distribution pattern based on product properties and comparing a test catch with “factory” test data.

The efficiency of catch trays is called into question. While we believe the collection tray data is acceptable to assess evenness of application, the application rate should be determined by direct measurement of weight applied to determined area.  Weighing samples involves very small quantities so scales weighing to 0.01g are required. Satisfactory options are readily available at reasonable price.

An alternative approach uses small measuring cylinders or syringe bodies to compare applied volumes. While not able to assess alternative driving patterns, this can give a direct and very visual immediate view of performance.

The Sustainable Farming Fund “On-Farm Fertiliser Applicator Calibration” project arose from repeated requests by farmers for a quick and simple way to check performance of fertiliser spreading by themselves or contractors. It was co-funded by the Foundation for Arable Research and the Fertiliser Association.

Rootzone reality – measuring nutrient losses

Drainage fluxmeters in commercial fields across the regions

P Johnstone, M Norris, S Green, G Clemens, C van den Dijssel, P Wright, G Clark & S Thomas
Plant & Food Research

Minimising nutrient losses from cropping systems makes good financial sense. It also minimises any adverse impacts on our waterways, which is increasingly important in many regions as new national water policy requirements are implemented.

A common theme in many regions is the requirement that growers should, as a minimum, be managing nutrients according to agreed good management practices. However, there is relatively little long-term measurement of how good management practices throughout New Zealand impact losses of nitrogen (N) and phosphorus (P) from cropping paddocks.

To help fill this gap a network of permanent drainage fluxmeters has been established in commercial fields in the Canterbury, Manawatu, Hawke’s Bay, Waikato and Auckland regions over the last 18 months. There are a total of 12 sites in the network, covering a broad range of cropping systems, soil types, climatic conditions and management practices.

At each site fluxmeters have been installed at a depth of 1 m.  Any water from rainfall or irrigation events that drains to 1 m is captured by the fluxmeters. It is then pumped to the surface and analysed for nutrient concentrations. Net losses can be estimated by combining these measured concentrations and measured drainage volumes.

Preliminary results from the network have highlighted a wide range in N and P losses in drainage water. Many of the losses have been comparatively low to date, evidence that economic and environmental risks can be successfully balanced through the integration of good management practices.

Where high losses have been observed this has resulted from large drainage losses and high nutrient concentrations in the drainage water.

Importantly, this is a long-term initiative and the value of the information from the network will increase over time as growers and regional authorities consider long-term trends.

Fertiliser Calibration Resources Available

Development of procedures and resources for on-farm fertiliser spreader application checks have been completed. A trial workshop was run with farmers in Dunsandel and resources are available on-line.

The emphasis of the project is ensuring the right amount of fertiliser is evenly spread. The rate is check by dividing the amount applied by the area covered. Determining evenness is trickier.

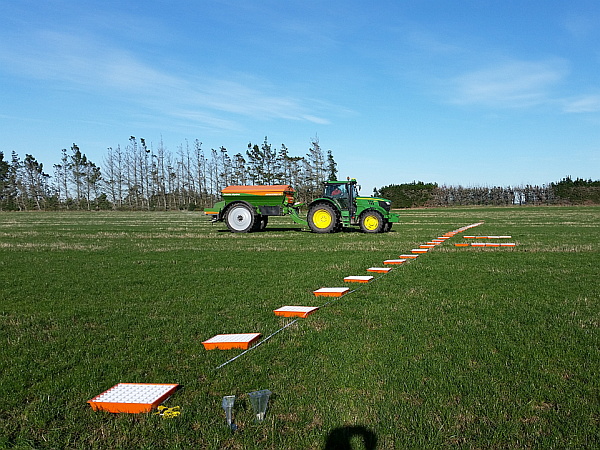
Like international systems and SpreadMark, pattern testing relies on sample collection in catch trays and mathematical analysis. A line of trays is laid across the path of travel, fertiliser collected and weighed, and data analysed.

Tray layout for a spreader pattern testTray layout for a spreader pattern test

To help the maths and reporting, an on-line calculator has been developed. This is publicly available at www.fertspread.nz.

The spreader test procedures will be presented at workshops at the FAR Waikato Arable Research Site on 10 December 2015, at Arable Y’s in Ashburton in April 2016. Other opportunities will be advised as confirmed.

More information and downloads available on the LandWISE website.

New food production paradigms: why farm systems are changing


HBB_RSNZ_Header

A public lecture offered by the Hawke’s Bay Branch of the Royal Society of New Zealand

Dr Charles Merfield, Director
Future Farming Centre, Biological Husbandry Unit Lincoln

7:00pm – 8:30 pm, Wednesday 26th August 2015
Hawke’s Bay Holt Planetarium, Chambers St,  Napier

13032009338 smModern farming systems are 70 years old. They have been very successful at meeting their key aim; maximising food production. However, society is asking farmers to take on new aims including providing ecosystem services to protect and enhance the environment.

Four key technologies created modern farming: fossil fuels, synthetic nitrogen fertilisers, soluble lithospheric fertilisers and agrichemical pesticides. There are increasing issues with each of these both from the input (e.g. cost, resistance) and outcome (e.g. pollution) sides.

Sustainable agriculture is smart agriculture that uses all available tools to find long lasting alternatives. A key to developing and analysing farm systems is overlapping the sciences of physics, chemistry, biology and ecology. Sustainable farming can be viewed as a martial art, probing and testing the opponent’s strengths and weaknesses then using smarts, not brute force, to win the contest.

Viewing farming through the eye of Darwin’s Law of Evolution will allow more sustainable and durable solutions to be developed.

Charles MerfieldDr Charles Merfield is the founding head of the BHU Future Farming Centre which focuses on ‘old school’ agri/horticultural science and extension.

Charles studied commercial horticulture in the UK and then spent seven years managing organic vegetable farms in the UK and NZ.

In the mid 1990s he moved into research, focusing on sustainable agriculture including soil management, pest, disease and weed management general crop and pasture production.

He has been fortunate to work and experience agriculture in diverse range of countries including NZ, UK, Ireland, USA and Uruguay. He therefore has a broad knowledge of real-world farming as well as science as well a deep understanding of the history of agriculture and science, which enables him to paint the big-picture of where modern farming has come from and where it is going.

Thanks to the Foundation for Arable Research, Charles Merfield will also be offering one day workshops for farmers and industry.  For details see the FAR website>

FAR

Free Fertiliser Spreader Test Tool Released

What is FertSpread?

FertSpread is a free-to-use on-line calculator and reporting tool to support on-farm calibration of fertiliser spreading equipment. It can be used on any internet connected device: computer, tablet or smartphone.

FertSpreadScreenShot

Access FertSpread at www.fertspread.nz

FertSpread uses field test results to calculate fertiliser product Size Guide Number (SGN) and Uniformity Index (UI) ensuring that evenness of application is within the recommended ranges.

Other calculations include fertiliser flow rate, required spreader speed, and actual application rate (kg/ha).

Finally and most importantly the tool allows you to analyse your Broadcast spreader configuration and based on your test results allows you to optimise your bout widths and ensure that you’re laying consistent, cost effective fertiliser spread patterns where ever possible.

Why was FertSpread developed?

FertSpread is one output from the Sustainable Farming Fund “On-Farm Fertiliser Applicator Calibration” project. The project arose from repeated requests by farmers for a quick and simple way to check performance of fertiliser spreading by themselves or contractors.  They wanted to know that spreading was acceptable.

Fertiliser application calibration procedures suitable for farmers applying nutrients with their own equipment allow on-farm checks to ensure and demonstrate application equipment is performing to expectations.

A calibration check includes assessment and correcting of both application rate (kg/ha) and uniformity (CV). Farmers indicated that checking the paddock application rate is reasonably easy and commonly done. Very few reported completing any form of uniformity assessment.

Assessing Performance

Uniformity requires collection of samples from a spreading event and calculation of a uniformity value. It will involve either physical or theoretical over-lapping of adjacent swaths. Use of standard test trays is strongly advised, given the need for baffling to stop fertiliser bouncing out.

Weighing samples is complicated by the very small quantities involved – often a single prill in the outer containers. Scales weighing to 0.01g are required, but satisfactory options are readily available at reasonable price. If a larger sample is wanted, two or more runs at the chosen application rate should be made rather than applying some higher rate.

Analysing collected data

Analysing fertiliser spread data is a somewhat complex task. The effect of overlapping runs (either round and round or to and fro) needs to be taken into account, and then the statistics to describe how uniform application is must be made. And in most cases, calculations should consider a number of different bout widths.

FertSpread was developed to process collected field data and generate statistical reports automatically. This reduces potential errors and makes the whole process very quick and efficient.

Key outputs are measured application rate, the CV at the specified bout width and the bout width range at which CV is within accepted limits.

The results of the uniformity test are given as the bout width where the coefficient of variation (CV) does not exceed a specified level. The maximum accepted CV is 15% for nitrogenous fertilisers and 25% for low analysis fertilisers.

NOTE:   Different types of collection trays show varying levels of capture during testing. Some can lose a significant amount of fertiliser through “bounce-out”.  Experience suggests the uniformity calculations are reasonably accurate, but the application rate may be under-reported. Check the application rate by dividing the quantity of fertiliser discharged by the area covered.

This project was undertaken by LandWISE Inc with funding from the MPI Sustainable Farming Fund. It was co-funded and supported by the Foundation for Arable Research and the Fertiliser Association.

FertSpreadPartners

Pioneering Precision

Aerial Imaging for Better Data Collection

Rural Delivery Series Eleven, Episode 24
Saturday 22 August 7am TVOne

The use of sensors of one kind or another is nothing new in agriculture, particularly in the hands of cropping farmers.  But a new imaging tool is currently being evaluated at Massey University.  It was originally designed for space exploration and military operations but is now being adapted for data collection, to help farmers make the best management decisions possible.

The sensor is flown over land, gathering images from more than 450 wavebands including visible, near, short and infra-red.  Maps of farms are developed, identifying pasture quality, nutrient content, potassium and sulphur levels, land surface temperatures, and areas of poor drainage as well as nutrient movements on slopes.

Professor Ian Yule of Precision Agriculture at Massey University says in the past, remote sensing has tended to focus on nitrogen use but the more sophisticated sensors allow the presence and concentration of other nutrients to be determined.

The technology is being used as part of Pioneering to Precision, a Primary Growth Partnership Programme (PGP) with particular interest in fertiliser application on hill country, but Professor Yule says it will also have significance for the dairy industry.

Onions Research – three year project

LandWISE has partnered with Onions New Zealand and Plant & Food Research in a three year project focused on understanding variability in onion crops. The project is funding by Onions NZ and the MPI Sustainable Farming Fund.

Dr Jane Adams, OnionsNZ Research and Innovation Manager, says the project, “Enhancing the profitability and value of New Zealand onions” is designed to provide the industry with tools to monitor and manage low yields and variability in onion yield and bulb quality.

It will incorporate precision agriculture with initial work to be done at the LandWISE MicroFarm. At the MicroFarm, we have been building increasing knowledge of the site, but will ramp that up with more layers of soil and crop information as we try to unpick factors contributing to lower yields and reduced quality.

Information about the 2014-2015 MicroFarm Onion crop can be found on the MicroFarm website.

The project proper starts on 1 July, but there has a lot of preparatory activity to ensure everything kicks of smoothly.

Anyone interested in joining a regional Focus Group supporting the project should
contact us>

OnionsNZ