Category Archives: Projects

Onion variability Year 1

OnionsNZ

Enhancing the profitability and value of New Zealand onions

The purpose of this OnionsNZ MPI Sustainable Farming Fund research project is to provide the industry with tools to monitor and manage low yields and variability in onion yield and bulb quality.

In this collaboration with Plant & Food Research, LandWISE is providing precision agriculture paddock scale measurement and interpretation.

We have base maps from topography and surface ponding analysis completed by Page Bloomer Associates, and from AgriOptics Dual EM soil mapping. We also have some previous crop data including true colour, false colour and NDVI images of winter cover crops between successive onion crops in these paddocks. More details here>

We tracked crop development with a range of sensor technologies including AltusUAS MicaSense from UAV, Agricultural Software GroundCover app and some satellite imagery.

The collaboration with Plant & Food Research was to help us develop protocols to monitor crop development and yield variation (spatially and temporally). Linking these with crop modelling and agronomy helps determine why variation is occurring.

Crops were traced from paddock through harvest and storage so that post-harvest quality issues can be related to factors during growth. Linking paddock production to packhouse performance and back again may be key in unlocking value potential.

Grower led focus groups are involved in the project and analysis of results. They have a vital role in the development of practical tools they can use to monitor and quantify variability, to identify the causes of loss of yield and quality and share best practice to improve sustainability and grower returns.


Onion Research Underway

OnionsNZ

After months of planning our OnionsNZ, Plant and Food, Sustainable Farming Fund onion variability project, things are underway at the MicroFarm!

Gerry Steenkamer planted the crop on 2nd August. Rhinestone seed was donated by Vigour Seeds and treated for us by Seed and Field Services. We are very grateful for their support.

An initial residual herbicide application of Dacthal and Stomp was applied. We had a lot of wireweed last year and are keen to get on top of that.

PlantandFoodwebPlant and Food Research staff have established plots for detailed monitoring. They are doing many very detailed individual plant measurements at plot scale. LandWISE is coordinating a number of sensing surveys of the whole crop using a range of technologies.

20150805_PlotMarking
Plant and Food staff setting up monitoring plots in onions beds. (Wintery southerly)

More details for the research programme and measurements are available on the MicroFarm website.

Plant and Food researchers have developed growth models for a range of crops. This work will help refine their onion growth model, a key to understanding the development and variability in crops. The detailed plot measurements will also be compared with the whole paddock sensor measurements to corroborate and calibrate them.

The first paddock scale surveys have been completed. These give some base information and understanding of the site and it’s variability. Maps as pdfs are available on the MicroFarm website.

One of the first “layers” we can look at is Google Earth imagery – free info on the web! Have a look at your place: use the time slider to view a series of aerial and satellite images captured over recent and not so recent years.


MicroFarm Onion Beds with Winter Cover Crops (as shown on Google Earth image 19 April 2015)

We have posted some of “our place” images and some interpretation here>.

Pagebloomer vsPage Bloomer Associates completed an RTK-GPS survey using Trimble equipment from GPS Control Systems. The data were used to create surface ponding and runoff risk maps.

agriopticsAgriOptics completed a Dual-EM survey in early July. This gave shallow and deep soil information maps. The dry winter means soil had not reached field capacity when the survey was made, so we are a little cautious when interpreting the results. But we risked not getting a survey at all, and by planting in August it had still not rained.  With beds formed and crop planted and emerging, we have no opportunity now to repeat the survey.

AltusUAVAltusUAS has prepared NDVI maps of cover crops from UAV mounted sensors. They will be making repeated measurements as the crop develops. AltusUAS is now using MicaSense technology for efficient multispectral image collection.


ASL_Square_150ASL Software has provided their Cover Map canopy cover measurement tool fitted with high accuracy GPS. We can now use that technology to measure relative plant development and ensure our readings (our mapped data) are located in the correct beds!

BioRich Tractor for MicroFarm

The arrival of a BioRich sponsored tractor at the LandWISE MicroFarm will support precision farming research efforts.

BioRich_JD900HCWeb
The John Deere high clearance cropping tractor is set to match the onion beds at the MicroFarm.

The John Deere cropping tractor has been set to a 183cm wheel track to fit the onion beds planted in early August. It’s first role is to act as a carrier of sensors that are used to map crop development.

We are delighted with the tractor. After much investigation into options for a sensor carrier, we finally landed on a high clearance cropping tractor as the ideal machine. Then, after searching wide and long, we discovered there was one sitting on our back door.

BioRich Principal, Mike Glazebrook is a LandWISE founding member and past Chairman. He said he was keen to support  the work being done at the MicroFarm as he sees it as of benefit to the community. There is obvious alignment with LandWISE objectives for sustainable production.

BioRich Limited is an organic waste recycling company. It’s main activity is capturing organic material that would otherwise be wasted, or cause pollution, and turning it into rich compost. Where it is practical to do so it also seeks to extract stock food and energy from organic material that would otherwise be wasted.

Every year, throughout New Zealand, many thousands of tonnes of organic “waste” is dumped into landfills or is inappropriately discharged to land. Once dumped much of this material breaks down in an uncontrolled manner and releases greenhouse gases into the atmosphere and pollutants into our waterways.

Meanwhile most of New Zealand’s cultivated soils have been steadily deteriorating. This is due to both to a decline in soil organic matter and a depletion of minerals and nutrients.

Hence BioRich’s mission is to divert organic matter (carbon) from ending up in places where it can do a lot of harm – in our atmosphere and water – and putting it somewhere it can do a lot of good – in our soils.

Free Fertiliser Spreader Test Tool Released

What is FertSpread?

FertSpread is a free-to-use on-line calculator and reporting tool to support on-farm calibration of fertiliser spreading equipment. It can be used on any internet connected device: computer, tablet or smartphone.

FertSpreadScreenShot

Access FertSpread at www.fertspread.nz

FertSpread uses field test results to calculate fertiliser product Size Guide Number (SGN) and Uniformity Index (UI) ensuring that evenness of application is within the recommended ranges.

Other calculations include fertiliser flow rate, required spreader speed, and actual application rate (kg/ha).

Finally and most importantly the tool allows you to analyse your Broadcast spreader configuration and based on your test results allows you to optimise your bout widths and ensure that you’re laying consistent, cost effective fertiliser spread patterns where ever possible.

Why was FertSpread developed?

FertSpread is one output from the Sustainable Farming Fund “On-Farm Fertiliser Applicator Calibration” project. The project arose from repeated requests by farmers for a quick and simple way to check performance of fertiliser spreading by themselves or contractors.  They wanted to know that spreading was acceptable.

Fertiliser application calibration procedures suitable for farmers applying nutrients with their own equipment allow on-farm checks to ensure and demonstrate application equipment is performing to expectations.

A calibration check includes assessment and correcting of both application rate (kg/ha) and uniformity (CV). Farmers indicated that checking the paddock application rate is reasonably easy and commonly done. Very few reported completing any form of uniformity assessment.

Assessing Performance

Uniformity requires collection of samples from a spreading event and calculation of a uniformity value. It will involve either physical or theoretical over-lapping of adjacent swaths. Use of standard test trays is strongly advised, given the need for baffling to stop fertiliser bouncing out.

Weighing samples is complicated by the very small quantities involved – often a single prill in the outer containers. Scales weighing to 0.01g are required, but satisfactory options are readily available at reasonable price. If a larger sample is wanted, two or more runs at the chosen application rate should be made rather than applying some higher rate.

Analysing collected data

Analysing fertiliser spread data is a somewhat complex task. The effect of overlapping runs (either round and round or to and fro) needs to be taken into account, and then the statistics to describe how uniform application is must be made. And in most cases, calculations should consider a number of different bout widths.

FertSpread was developed to process collected field data and generate statistical reports automatically. This reduces potential errors and makes the whole process very quick and efficient.

Key outputs are measured application rate, the CV at the specified bout width and the bout width range at which CV is within accepted limits.

The results of the uniformity test are given as the bout width where the coefficient of variation (CV) does not exceed a specified level. The maximum accepted CV is 15% for nitrogenous fertilisers and 25% for low analysis fertilisers.

NOTE:   Different types of collection trays show varying levels of capture during testing. Some can lose a significant amount of fertiliser through “bounce-out”.  Experience suggests the uniformity calculations are reasonably accurate, but the application rate may be under-reported. Check the application rate by dividing the quantity of fertiliser discharged by the area covered.

This project was undertaken by LandWISE Inc with funding from the MPI Sustainable Farming Fund. It was co-funded and supported by the Foundation for Arable Research and the Fertiliser Association.

FertSpreadPartners

Onions Research – three year project

LandWISE has partnered with Onions New Zealand and Plant & Food Research in a three year project focused on understanding variability in onion crops. The project is funding by Onions NZ and the MPI Sustainable Farming Fund.

Dr Jane Adams, OnionsNZ Research and Innovation Manager, says the project, “Enhancing the profitability and value of New Zealand onions” is designed to provide the industry with tools to monitor and manage low yields and variability in onion yield and bulb quality.

It will incorporate precision agriculture with initial work to be done at the LandWISE MicroFarm. At the MicroFarm, we have been building increasing knowledge of the site, but will ramp that up with more layers of soil and crop information as we try to unpick factors contributing to lower yields and reduced quality.

Information about the 2014-2015 MicroFarm Onion crop can be found on the MicroFarm website.

The project proper starts on 1 July, but there has a lot of preparatory activity to ensure everything kicks of smoothly.

Anyone interested in joining a regional Focus Group supporting the project should
contact us>

OnionsNZ


Testing On-Farm Fertiliser Spreading

LandWISE 2015 Presenter, Dan Bloomer

DanBloomer200
Dan is the Manager of LandWISE Inc, an independent consultant, and a member of the Precision Agriculture Association of New Zealand Executive.

The SFF “On-Farm Fertiliser Applicator Calibration” project arose from repeated requests by farmers for a quick and simple way to check performance of fertiliser spreading by themselves or contractors.  They wanted to know that spreading was acceptable.

A calibration check includes assessment and correcting of both application rate (kg/ha) and uniformity (CV). Farmers indicate determining the rate is reasonably easy and commonly done. Very few report completing any form of uniformity assessment.

There are many protocols internationally relating to the spreading of fertiliser products. Lawrence (2007) compared six test methods.

1400 tray matrix used to collect 18 simultaneous transverse tests on a Transpread “W” twin chain spreader From Lawrence, 2006
1400 tray matrix used to collect 18 simultaneous transverse tests on a Transpread “W” twin chain spreader, From Lawrence, 2006

Most used 0.5 m trays organised in a single transverse row to capture the spread pattern of the spreader. No account is taken of the longitudinal variation between individual rows when multiple tests are carried out.

Larwnce Comparisons

The results of the test are given as the bout width where the coefficient of variation (CV) does not exceed a specified level. In all cases the maximum allowable CV is 15% for nitrogenous fertilisers and 25% for low analysis fertilisers.

An On-Farm Protocol

There is no set method dor assessing uniformity. On-farm testing could use a set number of collectors per swath (spacing changes with swath width) or a set spacing between containers (container number varies with swath width). Farmers can decide.

There are however some important principles:

  • Uniformity requires collection of samples from a spreading event and calculation of a uniformity value.
  • Set equipment up correctly according to manufacturer’s instructions
  • Ensure the spreader is horizontal, and at the correct height off the ground
  • Use standard test trays, given the need for baffling to stop fertiliser bouncing out
  • Ensure the spreader is driven well past the trays to capture all fertiliser
  • If a larger sample is wanted, two or more runs at the chosen application rate should be made rather than applying a higher rate.
FertSetUp
Set equipment up correctly according to manufacturer’s instructions
FertTrays
A line of trays laid out across the full width of spread to catch fertiliser. Use standard test trays, given the need for baffling to stop fertiliser bouncing out

Weighing samples is complicated by the very small quantities involved – often a single prill in the outer containers. Scales weighing to 0.01g are required, but satisfactory options are readily available at reasonable price.

An alternative is to assess the volume of fertiliser captured in each tray. Disposable syringe bodies make good measuring cylinders.

FertTestRack
Disposable syringe bodies make good measuring cylinders

Determining a field uniformity will involve either physical or theoretical over-lapping of adjacent swaths.

FertOverlap
Determining a field uniformity will involve either physical or theoretical over-lapping of adjacent swaths

On-line software is being developed to process data and generate statistical reports. Key outputs will be measured application rate, the CV at the specified bout width and the bout width range at which CV is within accepted limits.

Test spread-pattern checks performed to date show there is a need for wider testing by farmers. Unacceptable CVs and incorrect application rates are not unusual.


There remains some question about the percentage of fertiliser caught in some types of tray

The SFF project is co-funded by the Foundation for Arable Research and the Fertiliser Association

FertResearch

FAR


More adequate or less better sensor arrays and wireless networks

LandWISE 2015 Presenter – Gert HattinghInstalling the WINTEC wireless soil moisture sensor array
Installing the WINTEC wireless soil moisture sensor array

Gert Hattingh is Industry Research Champion at the Waikato Institute of Technology in Hamilton.

Gert’s current work involves finding ways to build more sustainable and energy efficient homes, finding better ways for the normal household to live sustainably, and evaluating new technologies.

Gert says the most burning question in any business venture is whether your actions will cost you money, or make you money.  Any decision you make in the production, marketing or operational sphere has an influence on this statement.  This paradigm has been a design key since Wintec have ventured into producing cost effective sensor arrays and wireless networks.

In the modern measurement world, there are three cost drivers – quality of the sensor(s), the cost of the network carrying the data, and the cost of making sense of and using the data.

Gert and colleagues started off by looking at the network and the data carrier first, and designed a generic sensor module to host and manage almost any sensor type.  They also developed a database model that would host any data from sensors, as well as the encryption and data quality protocols.

To date, their system can host the following type of sensors:  GPS, Air Humidity, Air Temperature (2 sensors), Air pressure, solar irradiation, wind speed, wind direction, soil moisture (various sensors), pH, conductivity, dissolved oxygen, oxidation-reduction potential, ammonia, CO2, methane, propane, NOX and some alcohols.

A single sensor module can carry at most thirteen sensors, with a practical thirty sensor modules per network.  This totals to 390 sensors per network.

This technology is being trialed at the LandWISE MicroFarm, gathering, transmitting and processing soil moisture information from an array of sensors.

The Farm of 2030

The 2015 LandWISE Annual Conference attracted record numbers. It’s theme looked forward 15 years to contemplate what a farm might look like in 2030.

We are most grateful for the strong support of our many sponsors, a vital feature for bringing such events to the community.Sponsor_Sheet_600


You can see the full programme here>

RobertFitch2 TristanPerez1 Cheryl-McCarthy

Three speakers, Robert Fitch, Tristan Perez and Cheryl McCarthy, travelled from Australia to help lead discussions.

Tom Botterill PeterSchaare Ian Yule

Add Tom Botterill, Peter Schaare and Ian Yule

GertHattingh John Ahearn JohnChapman

Gert Hattingh, John Ahearn and John Chapman

BruceSearle200 FinlaysonChristina_200x200 geoff-low-res-e1423206134526

Bruce Searle, Christine Finlayson and Geoff Bates plus others from New Zealand and see the wealth of knowledge and experience available.

You can see all speakers and their biographies here>

On Day 1, presenters discussed sensing, control and robotics. Developments in this area are proceeding remarkably fast, with prototype machines finding their own way around farms, identifying weeds by species and applying custom treatments including sprays only to leaves. Additional presentations on pasture and plant quality detection, grapevine pruning and fruit quality analysis made it a full informative day.

At the end of the day, delegates formed small teams to design their dream agricultural robots – an excellent way to consolidate information. The key however, was identifying what their robots should do (not how) and describing the constraints under which it would need to operate.

As soon as you state a “how” you limit the options that can be considered in determining the final design. Maybe it shouldn’t be a 4-wheeled rover, but an aerial vehicle, or even a ground crawler. Get the specifications right, and the design will identify itself.

AgBot - image from Queensland University of Technology
AgBot – image from Queensland University of Technology

Day 2 began with discussions around variability. Identifying what variability exists, where it is and whether it justifies custom management is a critical starting place. Speakers also focused on managing two important farm  inputs to ensure the right job is done – seed placement and fertiliser application.

Day 2 was completed at the LandWISE MicroFarm at the Centre for Land and Water. There were demonstrations of in-field nitrogen testing, a soil pit to examine, a robot pulling a urine patch detector, a one pass strip-till and planting machine, testing fertiliser spreaders and UAVs.

AltusMissionNDVI
An AltusUAS UAV takes off at the Centre for Land and Water, a mission to collect data at the LandWISE MicroFarm

Something for every forward thinking agriculturist!

More on-line here>


MicroFarm Update March 2015

MicroFarm happenings are updated on Twitter @LandWISENZ with tweets appearing on both the LandWISE main website and the MicroFarm specific site.

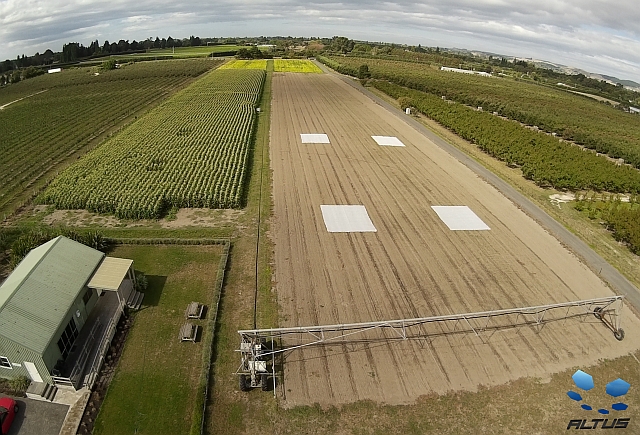
The aerial view above of the MicroFarm was provided by new Centre for Land and Water residents, AltusUAS. This is a wide angle colour image, but we are also looking forward to capturing a range of other image types over coming weeks.

So far this season we have completed fourteen irrigation rotations across our various crops. We have guidance from HydroServices soil moisture monitoring and advice. Their weekly reports are posted on the MicroFarm Irrigation Monitoring page.

The linear-move irrigator that the Ritchie family  provided has been critical to success this year – one of the driest we’ve seen for a while. In August we posted a story about rebuilding the linear from parts.

Now, part way through Cyclone Pam, Hawke’s Bay is getting much needed rain. In our case, this has been a manageable amount and we have been fortunate to avoid the strong winds that have caused trouble north of us.

Since last week we’ve received regular showers, with daily rain totals of 20mm, 10mm, 0mm, 5mm and 25mm and moderate rain continuing. So 75mm so far, with about 12mm ET in that time. You can access our weather data from the MicroFarm site weather page, provided for us by HortPlus MetWatch.

Cover crops planted last month are coming away well. We irrigated them to get them started, but with the current rain, that is probably it for the season. The mustard and the oat/vetch mix were both direct drilled by Mike Kettle Contracting.

Our two crops awaiting harvest are sweetcorn for McCain Foods and navy beans for Heinz-Watties. Both crops are looking good.

Looking at the AltusUAS image above, the gaps in the sweetcorn on the left are where crop samples were taken to compare growth of seedlings with and without cover.

At the far end of the MicroFarm, the navy beans glow yellow as they reach maturity. Despite the colour change, HydroServices soil moisture monitoring shows water use has remained high, suggesting plants remain active.

The four white squares in the paddocks on the right are cover cloth on our cover crops: mustard and on an oat/vetch blend. We will remove two covers soon and monitor growth. Two other covers will remain in place for a few more weeks.

We are keen to involve even more technology partners at the MicroFarm.

Wintec has established a trial network of soil moisture sensors which are being compared with the HydroServices neutron probe results.

Installing the WINTEC wireless soil moisture sensor array

CoverMapOnionsASL software, (LandWISE Yield Estimation software) and apps for pipfruit and irrigation industries) have developed a ground cover measurement tool. We used it to map MicroFarm onion crop canopies and found good correlation with final yields.

If you have something to test or demonstrate, or know someone that might add value, let us know!

Remember, you can follow @LandWISENZ on Twitter, or keep an eye on the MicroFarm website for the most up to date information on happenings.

MicroFarm News: Dec 2014

Recent postings on the MicroFarm Website

To December 2014

20141114_165126_web

Monitoring Variability in Peas

Peas are one crop that has huge variation. It’s hard to know if the crop will yield four tonnes per hectare or twelve. Even within small sampling plots we measured yields less than 4 t/ha and greater than 13 t/ha. More>

20141128_103522-web

Monitoring Variability in Onions

Our first MicroFarm onion crop is extremely variable. We want to measure variability so we can better assess it. If we can measure objectively we can make better decisions. We are interested in spatial variability and temporal variability. More>