6 – 8 PM, Tuesday 25 August 2015
Century Cinema, MTG, Napier
In this International Year of Soils, Hawke’s Bay Regional Council has arranged a public viewing of the innovative documentary, “Symphony of the Soil” by Deborah Koons Garcia.
“Drawing from ancient knowledge and cutting edge science, Symphony of the Soil is an artistic exploration of the miraculous substance soil. By understanding the elaborate relationships and mutuality between soil, water, the atmosphere, plants and animals, we come to appreciate the complex and dynamic nature of this precious resource.”
“The film also examines our human relationship with soil, the use and misuse of soil in agriculture, deforestation and development, and the latest scientific research on soil’s key role in ameliorating the most challenging environmental issues of our time.”
The showing of the movie will be followed by pizza and a discussion forum.
A public lecture offered by the Hawke’s Bay Branch of the Royal Society of New Zealand
Dr Charles Merfield, Director Future Farming Centre, Biological Husbandry Unit Lincoln
7:00pm – 8:30 pm, Wednesday 26th August 2015 Hawke’s Bay Holt Planetarium, Chambers St, Napier
Modern farming systems are 70 years old. They have been very successful at meeting their key aim; maximising food production. However, society is asking farmers to take on new aims including providing ecosystem services to protect and enhance the environment.
Four key technologies created modern farming: fossil fuels, synthetic nitrogen fertilisers, soluble lithospheric fertilisers and agrichemical pesticides. There are increasing issues with each of these both from the input (e.g. cost, resistance) and outcome (e.g. pollution) sides.
Sustainable agriculture is smart agriculture that uses all available tools to find long lasting alternatives. A key to developing and analysing farm systems is overlapping the sciences of physics, chemistry, biology and ecology. Sustainable farming can be viewed as a martial art, probing and testing the opponent’s strengths and weaknesses then using smarts, not brute force, to win the contest.
Viewing farming through the eye of Darwin’s Law of Evolution will allow more sustainable and durable solutions to be developed.
Dr Charles Merfield is the founding head of the BHU Future Farming Centre which focuses on ‘old school’ agri/horticultural science and extension.
Charles studied commercial horticulture in the UK and then spent seven years managing organic vegetable farms in the UK and NZ.
In the mid 1990s he moved into research, focusing on sustainable agriculture including soil management, pest, disease and weed management general crop and pasture production.
He has been fortunate to work and experience agriculture in diverse range of countries including NZ, UK, Ireland, USA and Uruguay. He therefore has a broad knowledge of real-world farming as well as science as well a deep understanding of the history of agriculture and science, which enables him to paint the big-picture of where modern farming has come from and where it is going.
Thanks to the Foundation for Arable Research, Charles Merfield will also be offering one day workshops for farmers and industry. For details see the FAR website>
An initial residual herbicide application of Dacthal and Stomp was applied. We had a lot of wireweed last year and are keen to get on top of that.
Plant and Food Research staff have established plots for detailed monitoring. They are doing many very detailed individual plant measurements at plot scale. LandWISE is coordinating a number of sensing surveys of the whole crop using a range of technologies.
Plant and Food staff setting up monitoring plots in onions beds. (Wintery southerly)
Plant and Food researchers have developed growth models for a range of crops. This work will help refine their onion growth model, a key to understanding the development and variability in crops. The detailed plot measurements will also be compared with the whole paddock sensor measurements to corroborate and calibrate them.
The first paddock scale surveys have been completed. These give some base information and understanding of the site and it’s variability. Maps as pdfs are available on the MicroFarm website.
One of the first “layers” we can look at is Google Earth imagery – free info on the web! Have a look at your place: use the time slider to view a series of aerial and satellite images captured over recent and not so recent years.
MicroFarm Onion Beds with Winter Cover Crops (as shown on Google Earth image 19 April 2015)
AgriOptics completed a Dual-EM survey in early July. This gave shallow and deep soil information maps. The dry winter means soil had not reached field capacity when the survey was made, so we are a little cautious when interpreting the results. But we risked not getting a survey at all, and by planting in August it had still not rained. With beds formed and crop planted and emerging, we have no opportunity now to repeat the survey.
AltusUAS has prepared NDVI maps of cover crops from UAV mounted sensors. They will be making repeated measurements as the crop develops. AltusUAS is now using MicaSense technology for efficient multispectral image collection.
ASL Software has provided their Cover Map canopy cover measurement tool fitted with high accuracy GPS. We can now use that technology to measure relative plant development and ensure our readings (our mapped data) are located in the correct beds!
Dr Jane Adams, OnionsNZ Research and Innovation Manager, says the project, “Enhancing the profitability and value of New Zealand onions” is designed to provide the industry with tools to monitor and manage low yields and variability in onion yield and bulb quality.
It will incorporate precision agriculture with initial work to be done at the LandWISE MicroFarm. At the MicroFarm, we have been building increasing knowledge of the site, but will ramp that up with more layers of soil and crop information as we try to unpick factors contributing to lower yields and reduced quality.
Information about the 2014-2015 MicroFarm Onion crop can be found on the MicroFarm website.
The project proper starts on 1 July, but there has a lot of preparatory activity to ensure everything kicks of smoothly.
Anyone interested in joining a regional Focus Group supporting the project should contact us>
Dan is the Manager of LandWISE Inc, an independent consultant, and a member of the Precision Agriculture Association of New Zealand Executive.
In 1981, John Matthews of the UK National Institute for Agricultural Engineering described what a farm would look like in 2030; a fifty year horizon.
“The mechanical farm of 2030” identified four factors that would influence the farm of 2030; social factors including employment, preservation of the environment, animal welfare and primary energy sources.
Soil quality and alternative machinery were high on their list. Computers and robotics were available but GPS, internet and wireless were not.
In 2015, with all the benefits of knowing what happened in the last 35 years, we revisited the question to ask, “What will a cropping farm look like in 2030?” Were John Matthew’s predictions of technology on-track? And importantly, what must farmers do to ready themselves for next year, five years and fifteen years down the track?
The general consensus was a resounding round of applause for John Matthews. The issues he identified continue to be key drivers today. The technological developments he envisioned are progressing towards the 2030 deadline with examples of commercially developed gantries now being tested on farms in Europe.
The NIAE Gantry image from John Matthews paperThe ASALift Gantry tractor in 2013
John Matthews article included a robotic harvester. We know the computing and actuation required for that is still tricky, but it seems quite probable robotic harvesting will be feasible and possible it will be relatively common by 2030.
The NIAE robotic harvester image from Matthews’ paper
Perhaps his control tower windows are more likely to be computer monitors, and he didn’t know about smart phones, but his vision of the role computing would play is remarkably close – though perhaps thanks to Moore’s law and compounding development we have already got further than he estimated.
The NIAE image of a farm computer appears to have a rack for storage disks, but also shows a microphone and aerial perhaps for wireless communications.
Maybe the design (how) is different to now, but much of the what of John Matthews’ predictions suggests he deserves a high score.
Miles Grafton NZ Centre for Precision Agriculture, Massey University Institute of Agriculture and Environment
crops and pastures since upgrading to spreaders capable of spreading at increased, bout or swath widths. This issue is more prevalent where fertilizer blends of products with dissimilar ballistic properties are sown simultaneously.
The problem is more obvious when applicators have purchased modern top of the range twin disc spreaders with the ability to spread at an acceptable spread pattern at tram lines at or greater than 30 m. These spreaders have increased tram or bout widths of spread from 20 – 24 m, to greater than 30 m thus reducing the number of tram lines, increasing output and reducing trafficking of the crop or pasture.
Spreading at a tram line of 30 m requires a total spread pattern to be around 45 m, allowing for a pattern overlap of around 50%, to achieve the desired accuracy (Chok et al., 2014). Given that the spreading discs are around 0.5 – 1.5 m above ground level, then fertilizer particles must be discharged at some considerable speed.
Table 1: Distances typical fertiliser particles will travel when ejected at various speeds, in a horizontal plane from 1.5 metre height. (SSP is single superphosphate at 3 different sizes, KCl is potash, MAP is mono-ammonium phosphate, DAP di-ammonium phosphate). The distances are lateral from each disk; total spreading distance is twice that in Table 1.
In order to achieve an optimal even distribution, spreaders deliver 50% of the required amount of fertilizer on each side, which is overlapped with another 50% when the vehicle makes the next run in the opposite direction, or an adjacent run in a round and round spreading pattern. Therefore, the area closest to the border of the distribution area only receives half of the recommended rate as there is no pattern overlap and the desired fertilizer response, would then be reduced as if 50% of the desired rate on average has been applied.
Border spreading refers to the capacity to reduce the application distance on the side towards the border in order to minimize the amount of fertilizer applied outside the zone. Yield spreading compensates for the need to overlap by doubling the amount of fertilizer applied in the boundary side.
Product separation can be avoided by soil testing early, then addressing fertility issues by direct drilling or broadcast application prior to the crop establishing. Then use tram line application on crops for the one product intended to be side dressed during the crop life cycle.
Christina Finlayson, Research Associate, Plant and Food Research
Peas grown for processing can be a notoriously variable crop both in terms of overall productivity and maturity at harvest. In turn, this can have a significant impact on paid yields and grower profitability.
Many factors are thought to contribute to variability in peas – some of which are beyond grower control and some of which can potentially be influenced through management.
In recent years we’ve worked to consider a few of these ‘manageable’ factors, and specifically, the effect of seed characteristics on early crop vigour and the response of crops to plant growth regulators (PGRs).
The aim of this work has been to identify practices that reduce plant-to-plant variability in the field and maximise paid yield returns for growers and processors.
In our talk we present results from a greenhouse trial looking at the effect of seed characteristics on early crop growth, and how that relates back to the previous pea seed crop. Preliminary results suggested that different-sized pea seed can result in big differences in early plant size and growth.
Different-sized pea seed can result in big differences in early plant size and growth
These early differences in productivity are seldom overcome, so getting a consistent ‘start’ is important in minimising future variability issues. However additional variability develops following establishment .
In the field, we have conducted several trials assessing the potential efficacy of a range of PGRs on flowering dynamics and pea yields. Across these trials we’ve seen few clear effects of the PGR types, rates and timings that have been tested.
Bruce Searle, Crop Physiologist and Modeller Plant and Food Research
Why is a crop so variable and what can be done about it? And of that variability, how much can management practices actually affect?
Those who work with crops are well aware of this variability, but ways of addressing it are less clear.
Variability affects profitability so managing it is important. The more variable a crop is, the more the yield will be reduced compared to an even crop that produces the maximum attainable yield, and so profitability is reduced.
Increasingly, the value of a vegetable crop is dependent on providing product that meets some quality criteria – initially, usually size. This means that growing to maximise yield does not always increase profitability if the crop does not meet the quality standards. If variability is high then less of the crop will fall in the grades desired by the market and so profitability decreases.
Causes of variability are complex. It starts with the variability in seed size. Overlaid on this is variability in emergence time, variability in seedling size, variability in plant spacing and effects on competition, individual variability in relative growth rate, and differences in spatial supply of nutrients and water in the field and patchiness in pest and disease.
All these factors interact in different ways. Models are an ideal way to quantify some of this complexity and provide good insight, but the large number of measurements needed and the large number of interactions to compute can limit the value of such approaches.
Here we start to develop a conceptual framework that allows the causes of variability in a field to be identified and enables the contribution of each cause to be considered. We have called this framework the ‘V of variability’.
We group causes of variability into spread of emergence, establishment, population and growth, and examine how these factors change for crops of onions and potatoes and affect the variability of size in onions and potatoes and dry matter % of potatoes. We use this to identify how much variability is manageable and the appropriate key management practices to consider.
This framework, when linked with digital information capture at a field scale, could provide a powerful tool for management of variability.
Presentation Authors: Bruce Searle, Jeff Reid and Paul Johnstone – Plant and Food Research
Environmental pollution results, both from nitrate leaching and greenhouse gas emissions that arise from the high urea content of urine patches. This problem is possibly the biggest single threat to dairying in New Zealand. Pastoral Robotics’s solution addresses this threat whilst increasing the bottom line through increased grass growth without requiring large capital investment. This is in contrast to other methods of nitrate leaching reduction, all of which either reduce profitability and/or involve significant capital investment.
Pastoral Robotics’s solution allows the customer to increase profitability in the following ways:
Directly through increased grass growth
Indirectly through allowing the continuation of their current farming practice without additional costs
Indirectly through opening options to increase milk solids production within regional council-imposed nitrate-leaching or fertiliser N use limits.
The system
After the last cow leaves the paddock Spikey® is towed over the freshly grazed land detecting and treating the urine patches with ORUN®. ORUN® is sprayed only onto recent urine patches, meaning typically only 5% of the pasture has to be sprayed, a huge saving in chemicals.
Spikey® detects changes in the electrical properties of the soil caused by the presence of urine.
ORUN® is a combination of a commonly-used urease inhibitor NBPT (not DCD), and the widely-used growth-promotant gibberellic acid variant (GA3). ORUN® greatly increases the already large amount of extra dry matter grown in the vicinity of the urine patch, and with it recovery of urine-nitrogen. The NBPT increases the lateral spread of urea out from the urine patch; the GA increases the vigour of the growth. This increase in growth covers all costs of using Spikey®.
Increased pasture growth automatically means reduced environmental losses of N – independent testing of ORUN® by Massey University indicated a reduction in nitrate leaching from urine patches of up to 50% and N20 emissions by 27-37%.
The first commercial version of the Spikey® urine detector and simultaneous treatment with ORUN® spray have been designed to be towed behind an ATV or other farm vehicle.
Mini-ME®, an electric robotic tow vehicle, is under development to eventually take over the towing role, leaving the farmer free to concentrate on his stock.
Presentation authors: Geoff Bates and Bert Quin, Pastoral Robotics Limited
Dan is the Manager of LandWISE Inc, an independent consultant, and a member of the Precision Agriculture Association of New Zealand Executive.
In an attempt to understand variability in crops, smartphone photos were processed to assess canopy size. By geo-referencing such images, they can be used for spatial analysis. Preliminary results showed considerable promise and a tool has been developed.
One use is for detailed nutrient planning and variable rate application, which requires spatial knowledge of final yield. A case study of an onion crop at the LandWISE MicroFarm is used as an example. Onions have a potential yield of around 100t/ha but the mean national yield in an average year is only 35t/ha.
The onion crop was planted on 7 June 2014. Fertiliser was applied at three intervals, 2 August, 27 September and 24 October 2014. Yields before curing within this 1ha paddock ranged from 0 – 85 t/ha.
Overhead photos of the crop were taken across 18 crop beds on 1 October, 28 October and 14 November 2014. The images were processed by ASL Software Ltd to determine an estimate of ground cover. The crop was lifted on 8 January 2015 and fresh weights taken from each bed. These final yield results were compared to the images taken during crop development.
Data collected on 14 November show strong correlation with final yield; R2 = 0.86.
However, these data were collected three weeks after our final fertiliser application.
Photographs taken on 1 October had an average ground cover of 4.6% (range of 1.1 – 8.4%).
The measurements at this stage showed good correlation with final yield; R2 = 0.71 once one image with areas of surface algae was discounted.
The October images were taken four days after the second fertiliser application, which could easily have been delayed. They were collected three weeks before the third fertiliser application.
This research suggests simple image analysis can provide early indications of final yield. It also suggests such images can provide timely information for adjusting rates and variable rate fertiliser application in onion crops.
To investigate the potential to create canopy maps, we automatically captured GPS referenced images. The images were processed to determine ground cover and displayed on Google Earth.
All image capture and processing was built into a smartphone application by ASL Software. There was a strong spatial pattern that could allow variable rate application.
The accuracy of the smartphone GPS may be adequate for large scale assessment of crops in big paddocks. However, it was not able to correctly locate the images and subsequent ground cover factors within the correct onion bed. Connection to an accurate GPS signal is being included to better locate each image point.

 6 – 8 PM, Tuesday 25 August 2015


 Modern farming systems are 70 years old. They have been very successful at meeting their key aim; maximising food production. However, society is asking farmers to take on new aims including providing ecosystem services to protect and enhance the environment.
 Dr Charles Merfield is the founding head of the BHU Future Farming Centre which focuses on ‘old school’ agri/horticultural science and extension.


 Page Bloomer Associates
 AgriOptics
 AltusUAS
 ASL Software
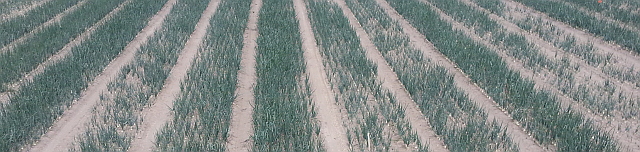


 The accuracy of the smartphone GPS may be adequate for large scale assessment of crops in big paddocks. However, it was not able to correctly locate the images and subsequent ground cover factors within the correct onion bed. Connection to an accurate GPS signal is being included to better locate each image point.