Flowering Patterns in Process Pea Paddocks

LandWISE farmers and processors want to increase vining pea yields, and importantly reliably higher yields. Last year many farms growing processing pea crops exceeded 10t/ha. But regularly crop yields are less than half that.

PodFillWe have been trying to determine factors controlling plant density, flowering, pod number, pea number and fill in process crops. Unlike seed peas, vining peas are harvested before the life cycle is complete. Any variation in maturity causes yield loss – both quantity and quality.

A small trial at the MicroFarm saw three lines of Ashton pea seed planted on the same day, using the same drill, seeking to achieve the same plant density of 110 plants/m2.

Sub-plots in each line were covered in Cosio cover mesh or an open bird netting to remove the effect of birds stealing seed or seedlings. This is important because recent years have seen a major increase in bird numbers and damage. We had 60 pigeons eating a 1ha crop. One farm shot 600 pigeons on one crop in one day and there were still hundreds eating.

At emergence, striping effects were immediately noticeable. We attribute this to drill settings because it repeated at the same spacing across the paddock. Half the width emerged later than the rest. What surprised us was the length of delay in some areas, plants emerging up to three weeks behind.

Variable coulter depth at planting leads to smaller canopy and delayed flowering
Variable coulter depth at planting seen in delayed emergence, smaller canopy and delayed flowering

On enquiry, we found the coulters were set differently to account for the area compacted by the tractor tyres versus uncompacted/untrafficked areas. The settings were clearly incorrect!

The trouble with this kind of issue is the delay in observing the problem.  In the period between planting this crop and our observation, many, many other crops could have been planted, all to suffer a similar problem.

How big is the problem?

We’ll take samples from the three seed lines, the cover options and the planter positions just before harvest. We’ll determine their yields and see what variation we find.

Fertiliser Calibration Resources Available

Development of procedures and resources for on-farm fertiliser spreader application checks have been completed. A trial workshop was run with farmers in Dunsandel and resources are available on-line.

The emphasis of the project is ensuring the right amount of fertiliser is evenly spread. The rate is check by dividing the amount applied by the area covered. Determining evenness is trickier.

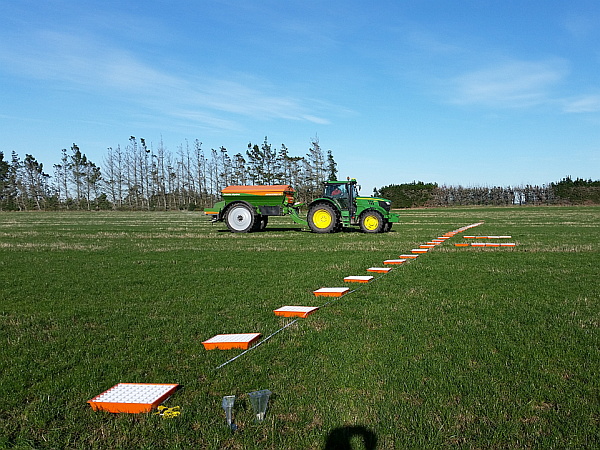
Like international systems and SpreadMark, pattern testing relies on sample collection in catch trays and mathematical analysis. A line of trays is laid across the path of travel, fertiliser collected and weighed, and data analysed.

Tray layout for a spreader pattern testTray layout for a spreader pattern test

To help the maths and reporting, an on-line calculator has been developed. This is publicly available at www.fertspread.nz.

The spreader test procedures will be presented at workshops at the FAR Waikato Arable Research Site on 10 December 2015, at Arable Y’s in Ashburton in April 2016. Other opportunities will be advised as confirmed.

More information and downloads available on the LandWISE website.

Onion variability Year 1

OnionsNZ

Enhancing the profitability and value of New Zealand onions

The purpose of this OnionsNZ MPI Sustainable Farming Fund research project is to provide the industry with tools to monitor and manage low yields and variability in onion yield and bulb quality.

In this collaboration with Plant & Food Research, LandWISE is providing precision agriculture paddock scale measurement and interpretation.

We have base maps from topography and surface ponding analysis completed by Page Bloomer Associates, and from AgriOptics Dual EM soil mapping. We also have some previous crop data including true colour, false colour and NDVI images of winter cover crops between successive onion crops in these paddocks. More details here>

We tracked crop development with a range of sensor technologies including AltusUAS MicaSense from UAV, Agricultural Software GroundCover app and some satellite imagery.

The collaboration with Plant & Food Research was to help us develop protocols to monitor crop development and yield variation (spatially and temporally). Linking these with crop modelling and agronomy helps determine why variation is occurring.

Crops were traced from paddock through harvest and storage so that post-harvest quality issues can be related to factors during growth. Linking paddock production to packhouse performance and back again may be key in unlocking value potential.

Grower led focus groups are involved in the project and analysis of results. They have a vital role in the development of practical tools they can use to monitor and quantify variability, to identify the causes of loss of yield and quality and share best practice to improve sustainability and grower returns.


Symphony of the Soil

SymphonyoftheSoil6 – 8 PM, Tuesday 25 August 2015
Century Cinema, MTG, Napier

In this International Year of Soils, Hawke’s Bay Regional Council has arranged a public viewing of the innovative documentary, “Symphony of the Soil” by Deborah Koons Garcia.

“Drawing from ancient knowledge and cutting edge science, Symphony of the Soil is an artistic exploration of the miraculous substance soil. By understanding the elaborate relationships and mutuality between soil, water, the atmosphere, plants and animals, we come to appreciate the complex and dynamic nature of this precious resource.”

“The film also examines our human relationship with soil, the use and misuse of soil in agriculture, deforestation and development, and the latest scientific research on soil’s key role in ameliorating the most challenging environmental issues of our time.”

The showing of the movie will be followed by pizza and a discussion forum.

Download printable flier here>

Gold coin donation, koha

IntYearofSoils HBRCColourLogo70mm

New food production paradigms: why farm systems are changing


HBB_RSNZ_Header

A public lecture offered by the Hawke’s Bay Branch of the Royal Society of New Zealand

Dr Charles Merfield, Director
Future Farming Centre, Biological Husbandry Unit Lincoln

7:00pm – 8:30 pm, Wednesday 26th August 2015
Hawke’s Bay Holt Planetarium, Chambers St,  Napier

13032009338 smModern farming systems are 70 years old. They have been very successful at meeting their key aim; maximising food production. However, society is asking farmers to take on new aims including providing ecosystem services to protect and enhance the environment.

Four key technologies created modern farming: fossil fuels, synthetic nitrogen fertilisers, soluble lithospheric fertilisers and agrichemical pesticides. There are increasing issues with each of these both from the input (e.g. cost, resistance) and outcome (e.g. pollution) sides.

Sustainable agriculture is smart agriculture that uses all available tools to find long lasting alternatives. A key to developing and analysing farm systems is overlapping the sciences of physics, chemistry, biology and ecology. Sustainable farming can be viewed as a martial art, probing and testing the opponent’s strengths and weaknesses then using smarts, not brute force, to win the contest.

Viewing farming through the eye of Darwin’s Law of Evolution will allow more sustainable and durable solutions to be developed.

Charles MerfieldDr Charles Merfield is the founding head of the BHU Future Farming Centre which focuses on ‘old school’ agri/horticultural science and extension.

Charles studied commercial horticulture in the UK and then spent seven years managing organic vegetable farms in the UK and NZ.

In the mid 1990s he moved into research, focusing on sustainable agriculture including soil management, pest, disease and weed management general crop and pasture production.

He has been fortunate to work and experience agriculture in diverse range of countries including NZ, UK, Ireland, USA and Uruguay. He therefore has a broad knowledge of real-world farming as well as science as well a deep understanding of the history of agriculture and science, which enables him to paint the big-picture of where modern farming has come from and where it is going.

Thanks to the Foundation for Arable Research, Charles Merfield will also be offering one day workshops for farmers and industry.  For details see the FAR website>

FAR

Onion Research Underway

OnionsNZ

After months of planning our OnionsNZ, Plant and Food, Sustainable Farming Fund onion variability project, things are underway at the MicroFarm!

Gerry Steenkamer planted the crop on 2nd August. Rhinestone seed was donated by Vigour Seeds and treated for us by Seed and Field Services. We are very grateful for their support.

An initial residual herbicide application of Dacthal and Stomp was applied. We had a lot of wireweed last year and are keen to get on top of that.

PlantandFoodwebPlant and Food Research staff have established plots for detailed monitoring. They are doing many very detailed individual plant measurements at plot scale. LandWISE is coordinating a number of sensing surveys of the whole crop using a range of technologies.

20150805_PlotMarking
Plant and Food staff setting up monitoring plots in onions beds. (Wintery southerly)

More details for the research programme and measurements are available on the MicroFarm website.

Plant and Food researchers have developed growth models for a range of crops. This work will help refine their onion growth model, a key to understanding the development and variability in crops. The detailed plot measurements will also be compared with the whole paddock sensor measurements to corroborate and calibrate them.

The first paddock scale surveys have been completed. These give some base information and understanding of the site and it’s variability. Maps as pdfs are available on the MicroFarm website.

One of the first “layers” we can look at is Google Earth imagery – free info on the web! Have a look at your place: use the time slider to view a series of aerial and satellite images captured over recent and not so recent years.


MicroFarm Onion Beds with Winter Cover Crops (as shown on Google Earth image 19 April 2015)

We have posted some of “our place” images and some interpretation here>.

Pagebloomer vsPage Bloomer Associates completed an RTK-GPS survey using Trimble equipment from GPS Control Systems. The data were used to create surface ponding and runoff risk maps.

agriopticsAgriOptics completed a Dual-EM survey in early July. This gave shallow and deep soil information maps. The dry winter means soil had not reached field capacity when the survey was made, so we are a little cautious when interpreting the results. But we risked not getting a survey at all, and by planting in August it had still not rained.  With beds formed and crop planted and emerging, we have no opportunity now to repeat the survey.

AltusUAVAltusUAS has prepared NDVI maps of cover crops from UAV mounted sensors. They will be making repeated measurements as the crop develops. AltusUAS is now using MicaSense technology for efficient multispectral image collection.


ASL_Square_150ASL Software has provided their Cover Map canopy cover measurement tool fitted with high accuracy GPS. We can now use that technology to measure relative plant development and ensure our readings (our mapped data) are located in the correct beds!

BioRich Tractor for MicroFarm

The arrival of a BioRich sponsored tractor at the LandWISE MicroFarm will support precision farming research efforts.

BioRich_JD900HCWeb
The John Deere high clearance cropping tractor is set to match the onion beds at the MicroFarm.

The John Deere cropping tractor has been set to a 183cm wheel track to fit the onion beds planted in early August. It’s first role is to act as a carrier of sensors that are used to map crop development.

We are delighted with the tractor. After much investigation into options for a sensor carrier, we finally landed on a high clearance cropping tractor as the ideal machine. Then, after searching wide and long, we discovered there was one sitting on our back door.

BioRich Principal, Mike Glazebrook is a LandWISE founding member and past Chairman. He said he was keen to support  the work being done at the MicroFarm as he sees it as of benefit to the community. There is obvious alignment with LandWISE objectives for sustainable production.

BioRich Limited is an organic waste recycling company. It’s main activity is capturing organic material that would otherwise be wasted, or cause pollution, and turning it into rich compost. Where it is practical to do so it also seeks to extract stock food and energy from organic material that would otherwise be wasted.

Every year, throughout New Zealand, many thousands of tonnes of organic “waste” is dumped into landfills or is inappropriately discharged to land. Once dumped much of this material breaks down in an uncontrolled manner and releases greenhouse gases into the atmosphere and pollutants into our waterways.

Meanwhile most of New Zealand’s cultivated soils have been steadily deteriorating. This is due to both to a decline in soil organic matter and a depletion of minerals and nutrients.

Hence BioRich’s mission is to divert organic matter (carbon) from ending up in places where it can do a lot of harm – in our atmosphere and water – and putting it somewhere it can do a lot of good – in our soils.

Free Fertiliser Spreader Test Tool Released

What is FertSpread?

FertSpread is a free-to-use on-line calculator and reporting tool to support on-farm calibration of fertiliser spreading equipment. It can be used on any internet connected device: computer, tablet or smartphone.

FertSpreadScreenShot

Access FertSpread at www.fertspread.nz

FertSpread uses field test results to calculate fertiliser product Size Guide Number (SGN) and Uniformity Index (UI) ensuring that evenness of application is within the recommended ranges.

Other calculations include fertiliser flow rate, required spreader speed, and actual application rate (kg/ha).

Finally and most importantly the tool allows you to analyse your Broadcast spreader configuration and based on your test results allows you to optimise your bout widths and ensure that you’re laying consistent, cost effective fertiliser spread patterns where ever possible.

Why was FertSpread developed?

FertSpread is one output from the Sustainable Farming Fund “On-Farm Fertiliser Applicator Calibration” project. The project arose from repeated requests by farmers for a quick and simple way to check performance of fertiliser spreading by themselves or contractors.  They wanted to know that spreading was acceptable.

Fertiliser application calibration procedures suitable for farmers applying nutrients with their own equipment allow on-farm checks to ensure and demonstrate application equipment is performing to expectations.

A calibration check includes assessment and correcting of both application rate (kg/ha) and uniformity (CV). Farmers indicated that checking the paddock application rate is reasonably easy and commonly done. Very few reported completing any form of uniformity assessment.

Assessing Performance

Uniformity requires collection of samples from a spreading event and calculation of a uniformity value. It will involve either physical or theoretical over-lapping of adjacent swaths. Use of standard test trays is strongly advised, given the need for baffling to stop fertiliser bouncing out.

Weighing samples is complicated by the very small quantities involved – often a single prill in the outer containers. Scales weighing to 0.01g are required, but satisfactory options are readily available at reasonable price. If a larger sample is wanted, two or more runs at the chosen application rate should be made rather than applying some higher rate.

Analysing collected data

Analysing fertiliser spread data is a somewhat complex task. The effect of overlapping runs (either round and round or to and fro) needs to be taken into account, and then the statistics to describe how uniform application is must be made. And in most cases, calculations should consider a number of different bout widths.

FertSpread was developed to process collected field data and generate statistical reports automatically. This reduces potential errors and makes the whole process very quick and efficient.

Key outputs are measured application rate, the CV at the specified bout width and the bout width range at which CV is within accepted limits.

The results of the uniformity test are given as the bout width where the coefficient of variation (CV) does not exceed a specified level. The maximum accepted CV is 15% for nitrogenous fertilisers and 25% for low analysis fertilisers.

NOTE:   Different types of collection trays show varying levels of capture during testing. Some can lose a significant amount of fertiliser through “bounce-out”.  Experience suggests the uniformity calculations are reasonably accurate, but the application rate may be under-reported. Check the application rate by dividing the quantity of fertiliser discharged by the area covered.

This project was undertaken by LandWISE Inc with funding from the MPI Sustainable Farming Fund. It was co-funded and supported by the Foundation for Arable Research and the Fertiliser Association.

FertSpreadPartners

On-Farm Trials – goals and objectives

The LandWISE On-Farm Trial Guide series provides clear yet comprehensive descriptions for people wanting to get the greatest benefit from on-farm research.

OnFarmTrialGuide Set smThis post looks at the first steps: getting your goals and objectives sorted. We acknowledge the original authors; Peter Stone, Andrea Pearson and Maaike Bendall (then of Crop & Food Research).

Setting goals and objectives – what do you want to find out and why?

Know what you want to know, and why you want to know it. If you’re not clear on these, don’t start on your trial.

You need to have a clear and simple statement of what you want to know (objective) and why you want to know it (goal). Goals are statements of the overall target that you want to reach. Objectives are the specific questions that need answering for you to achieve those goals.

Let’s start with goals. A common goal would be to increase gross margin per hectare. There are obviously lots of ways that you could try to achieve this, but for the purposes of a single trial you need to focus on a single approach. Your goal might be to see whether increased plant population increases your gross margin per hectare.

Once you’ve got your goal clear, you can move onto your specific objective. In this case, a common objective would be to compare the gross margin from your current population with that from a higher population. Gross margin is made up of expenditure and receipts, so fulfilling the objective will require you to measure the amounts and values of inputs and outputs. Objectives should always be measurable.

You can see that setting a clear goal led naturally to a simple objective which, in turn, suggested the sorts of treatments and measurements that will need to be made for the trial to succeed. This gets you through the worst of the planning stage!

Setting goals and objectives isn’t usually a difficult task, but it does require some care. Fuzzy goals usually lead to poorly defined objectives which, in turn, produce unfocused trials and inconclusive results – an all round waste of time and effort.

If you find that your objective doesn’t relate adequately to your goal, have another go at it. By the same token, if your objective requires tricky treatments or more data collection than you can handle, modify it. The key is to be clear and simple.

If your goal and objectives can’t fit into a simple sentence, you’re probably biting off more than you can chew. Write them down and see if they pass muster.

If they’re not quite right, have another go at it. You’ll never regret spending time getting this part of the trial planning process just right. Mistakes made here almost always lead to trouble down the line.

Having established an achievable goal and objectives, it’s time to think about the treatments that you’ll apply and the measurements that you’ll make on your trial.

Summary:

A simple statement of what you want to know and why you want to know it is the essential first step in running successful on-farm trials.

End of section critical decision point

Can you write a clear statement of what you want to know from trial, and why you want to know it? This is important if you are to get the best from the next section –Getting the treatments right.

Pioneering Precision

Aerial Imaging for Better Data Collection

Rural Delivery Series Eleven, Episode 24
Saturday 22 August 7am TVOne

The use of sensors of one kind or another is nothing new in agriculture, particularly in the hands of cropping farmers.  But a new imaging tool is currently being evaluated at Massey University.  It was originally designed for space exploration and military operations but is now being adapted for data collection, to help farmers make the best management decisions possible.

The sensor is flown over land, gathering images from more than 450 wavebands including visible, near, short and infra-red.  Maps of farms are developed, identifying pasture quality, nutrient content, potassium and sulphur levels, land surface temperatures, and areas of poor drainage as well as nutrient movements on slopes.

Professor Ian Yule of Precision Agriculture at Massey University says in the past, remote sensing has tended to focus on nitrogen use but the more sophisticated sensors allow the presence and concentration of other nutrients to be determined.

The technology is being used as part of Pioneering to Precision, a Primary Growth Partnership Programme (PGP) with particular interest in fertiliser application on hill country, but Professor Yule says it will also have significance for the dairy industry.

Promoting sustainable production